














Skip to content
Book a consult

Reporting Dashboards.

Reports That Build Themselves.

Automated reporting that pulls figures from your CRM, ad platforms, analytics and accounting tools into one dashboard in Looker Studio or Power BI, refreshed on a schedule and summarised to your inbox, Slack or Teams.

  • The few metrics that matter
  • Automated data pipelines
  • Scheduled summaries
  • Data-quality checks
As you enter the Business Nebula, invisible forces are aligning. Here, strategy shapes design, imagination grounds form, and logic defines the framework beneath it all. Every decision is deliberate, every connection engineered for clarity and intent. Here, we build with precision and purpose: systems designed to lead their markets and open new ones. Here, stars are forged.

Brands We’ve Delivered For

JKA & Co logo
Axiom Realty logo
DISP Consulting Co logo
Prestige Home Building logo
AMC Change Factor logo
Dynari Productions logo
Fredi Construction logo
GT Autosound logo
Leading Services Group logo
Opal Capital logo
TAK Homes logo
TelcoCentric logo
Rose Park Psychology logo
IntegPro logo
buildwise Pro logo
medtech Pro logo
Infosec Pro logo

How We Deliver

Ready for Scale From Day One.

Metric Definition

Agree on the handful of numbers that drive decisions.

We work out who the dashboard is for and which decisions it should support, then define each metric in writing: where it comes from, how it is calculated and what a good or bad week looks like. Vanity figures stay out.
Data Pipelines & Build

Connect the sources once, then let them refresh.

Data from each source is connected through native connectors, scheduled exports or integrations, cleaned and joined so the figures line up. The dashboard is built around the agreed metrics, with filters only where someone will actually use them.

Delivery & Upkeep

Keep the numbers flowing and the trust intact.

Scheduled summaries go to the people who need them, and checks flag missing or unusual data before it misleads anyone. When a source tool changes or a new metric is needed, the dashboard is updated and the documentation with it.

Dashboard Design & Metric Definition

One Screen, the Right Numbers.

Most reporting fails because it shows everything. We design dashboards around a short list of agreed metrics, such as enquiries and cost per lead by channel, pipeline value by stage, revenue against target and job or project capacity, laid out so the important change is obvious at a glance.

We build in Looker Studio or Power BI depending on your stack and who needs access. Each metric has a written definition, so finance, sales and marketing are reading the same number.

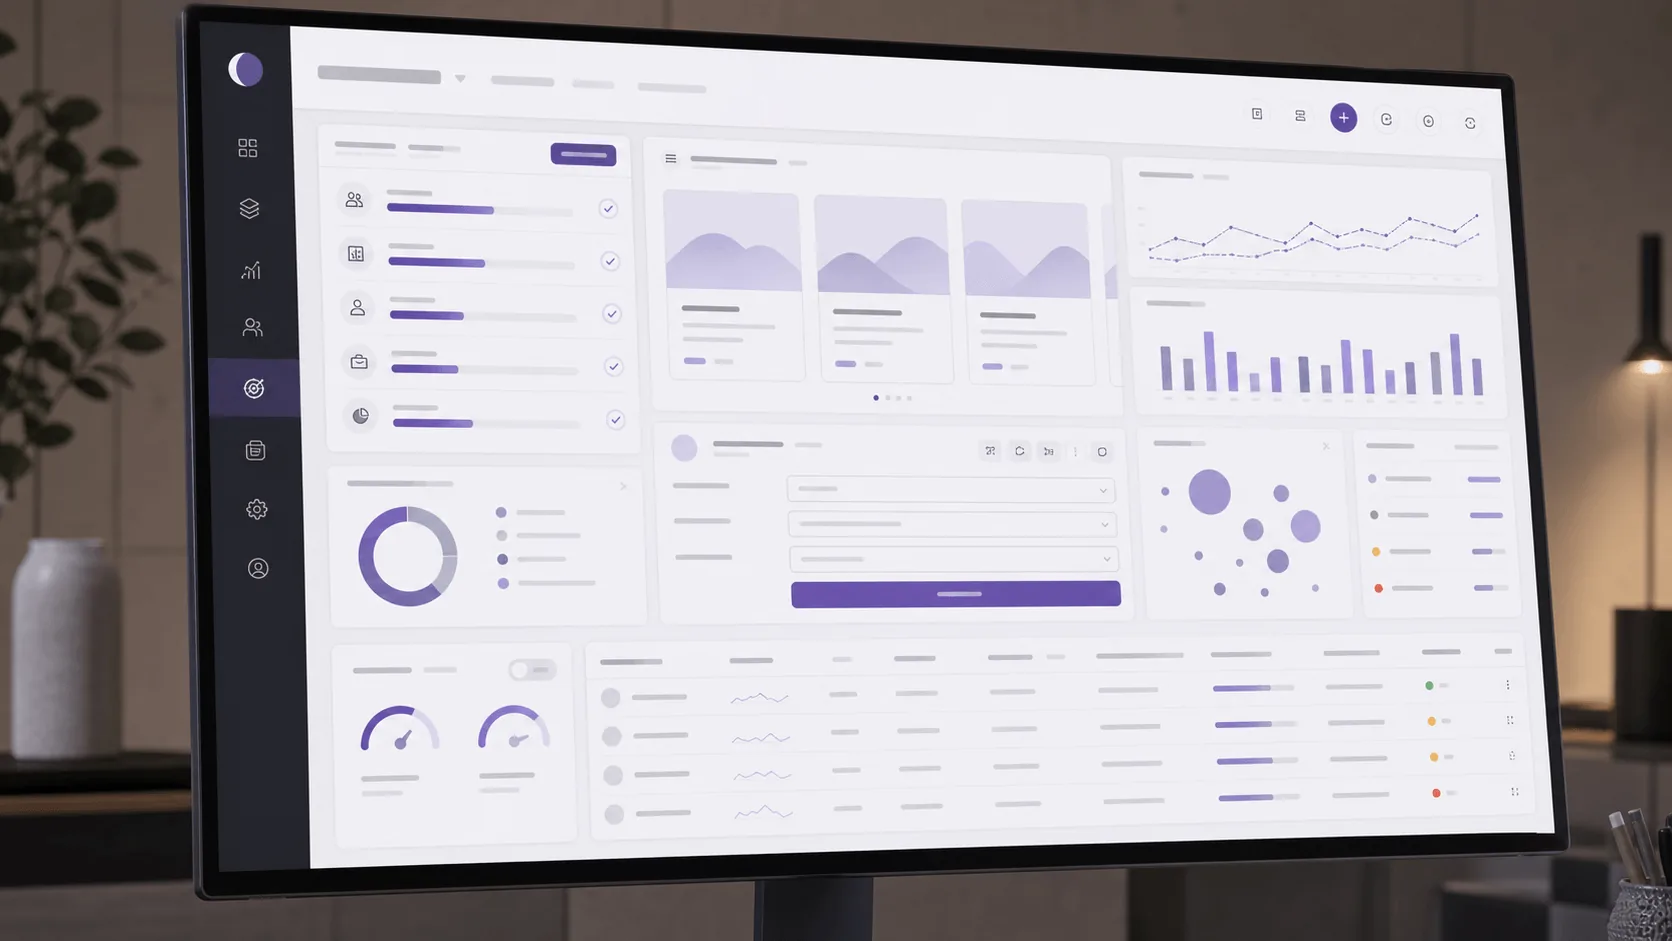
Business dashboard on a desktop monitor showing charts, progress bars and a data table

Data Pipelines & Integrations

Every Source Feeding One View.

We connect your CRM, Google Ads, Meta and LinkedIn Ads, GA4, accounting tools such as Xero or MYOB, and operational systems through native connectors, scheduled syncs or data integrations. Where several sources need joining or cleaning, data is staged in a spreadsheet or lightweight database before it reaches the dashboard.

Some platforms need a paid third-party connector to reach Looker Studio. We flag any licence cost before building, and choose the simplest option that stays reliable.

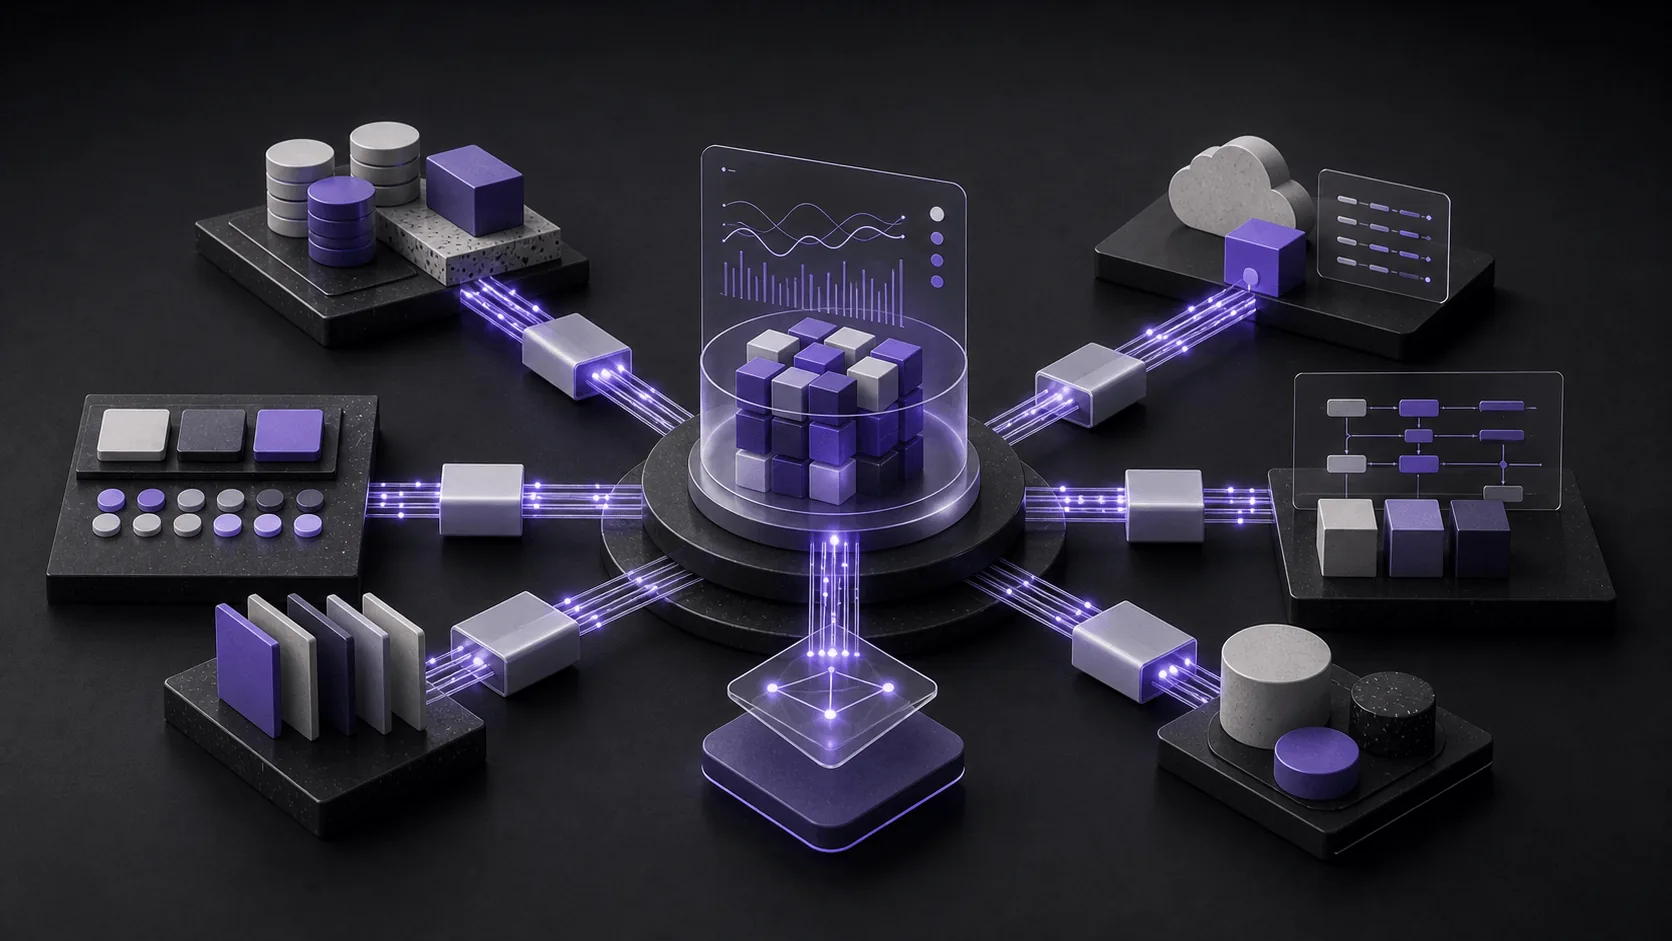
Abstract cross-platform integration architecture with connected system islands, data bridges and unified insight hub

Scheduled Summaries & Data Quality

The Report Comes to You.

Not everyone will open a dashboard. We set up scheduled summaries, such as a Monday email or a Slack or Teams post with last week's key figures and a link to the detail, so the numbers reach people where they already work.

Access is set by role, so people see the data they need and nothing more. Automated checks watch for failed refreshes, missing days and figures outside the normal range, and alert someone before a wrong number reaches a meeting.

Two people reviewing printed reports with charts, graphs and audience profiles on a desk

Related work

Projects that included Process Automation: the brief, what we built and what changed.
All case studies
  • Real Estate

    Axiom Realty

    Scaling a Boutique Real Estate Agency Through Integrated Digital Growth Systems.

    Portfolio
    110% ↑
    Pipeline
    $3.8m+
    ROAS
    positive
  • Defence · GRC

    DISP Consulting Co

    Building a National Defence Compliance Consultancy From Strategy to Scale.

    Revenue
    $560k+
    Reach
    national
    Pipeline
    expanded
  • Legal Services

    JKA & Co

    Modernising a Conveyancing Firm’s Brand, Website and Acquisition Stack.

    ROAS
    positive
    CPC
    reduced
    Leads
    improved

How we work

How We Work.

A short call, a written proposal, then the work. You know the scope, timing and cost before anything starts.

Process AutomationFrom $2,500A focused CRM automation or onboarding flow.

  1. A 20-minute consult

    A complimentary call to talk through the goal and check we are the right fit. We reply to every enquiry within one business day.

  2. A written proposal

    Deliverables, timeframes and pricing in writing. Changes to scope are agreed in writing too, before any extra work.

  3. Delivery in milestones

    You review each deliverable as it lands. Timelines depend on content, access and approvals, so we agree them up front.

  4. Handover

    On full payment, the final deliverables named in the proposal are yours. Ongoing support is available if you want it.

Services website
Typically 4–8 weeks, kickoff to launch
Retainers
Month to month after a 3-month minimum; 14 days’ notice
Payment
Fees as quoted, ex GST, due 7 days from invoice
Ownership
Final deliverables transfer to you on full payment

Ready When You Are

Tell Us the Goal. We’ll Scope the Rest.

You don’t need a brief. Bring the business goal and what’s getting in the way, and we’ll come back with a fixed-scope quote before any work starts.

Book a 20-minute consult
  • Complimentary 20-minute consult
  • Reply within one business day
  • Quote & clarity in 48 hours

Questions About Reporting Dashboards

Questions, Answered.

Should we use Looker Studio or Power BI?

Looker Studio suits businesses running on Google Workspace and Google's marketing tools, and is free to use, though some data connectors carry a fee. Power BI suits Microsoft 365 environments and handles heavier data modelling well, with licensing for the people who build and share reports. We recommend based on your existing tools, who needs access and how complex the data is.

Our numbers never match between systems. Can a dashboard fix that?

A dashboard exposes the mismatch; fixing it starts at the source. We trace why figures differ, whether that is duplicate CRM records, inconsistent lead sources or tracking gaps, and fix what we can upstream. For marketing data, that often means analytics and conversion tracking needs attention before the dashboard can be trusted.

What data sources can you connect?

Most tools with an API or export can be connected, including CRMs such as HubSpot, Pipedrive, Salesforce and Zoho, ad platforms, GA4, accounting tools such as Xero and MYOB, project and job management systems, and spreadsheets. Where a direct connector does not exist, we build the link through an integration platform or API.

Who maintains the dashboard after launch?

You own the dashboard, the data connections and the documentation. Your team can run it independently, or we can look after it on a care arrangement that covers monitoring, fixes when source tools change, and new metrics as the business grows.

How is reporting dashboard work priced?

Automation work starts from $2,500 for a focused build, such as a CRM automation or onboarding flow. Dashboard projects are quoted on scope as fixed proposals, based on the number of data sources, how much cleaning and joining the data needs, and how many audiences the reporting serves.

See published starting prices for every service line.

Where This Fits in Your Marketing

Automated Reporting as the Feedback Loop for the Business.

In many businesses, reporting means someone spending part of every week exporting figures from five tools into a spreadsheet, and the result is out of date by the time it is discussed. Automated dashboards replace that routine with a view that refreshes itself, uses agreed definitions and reaches people on a schedule. The time saved matters, but the bigger gain is that decisions are made on the same, current numbers.

A dashboard is only as reliable as the data feeding it. Analytics and conversion tracking makes sure marketing figures are accurate at the source, CRM and sales workflow automation keeps pipeline data complete and consistent, and data integrations move figures between systems that do not connect natively. Built on those foundations, reporting becomes something people check rather than something someone has to compile.

  • Business Nebula team and leadership profile representing strategic digital consultancy

Platforms We Work With

The Tools Behind the Work.

CallBook a 20-minute consult